-
For Resellers
-
-
For Clients
-
-
WHMCS Integration
Monitor server connections.
MojoCP Video Platform offers comprehensive monitoring of your streaming applications. Get real-time data on important metrics such as connection counts, network bandwidth, and connections over the last 7 days, last month, and by country. View all this information in one convenient location with the help of an interactive map. Stay on top of your streaming performance with MojoCP Video Platform’s monitoring tools.
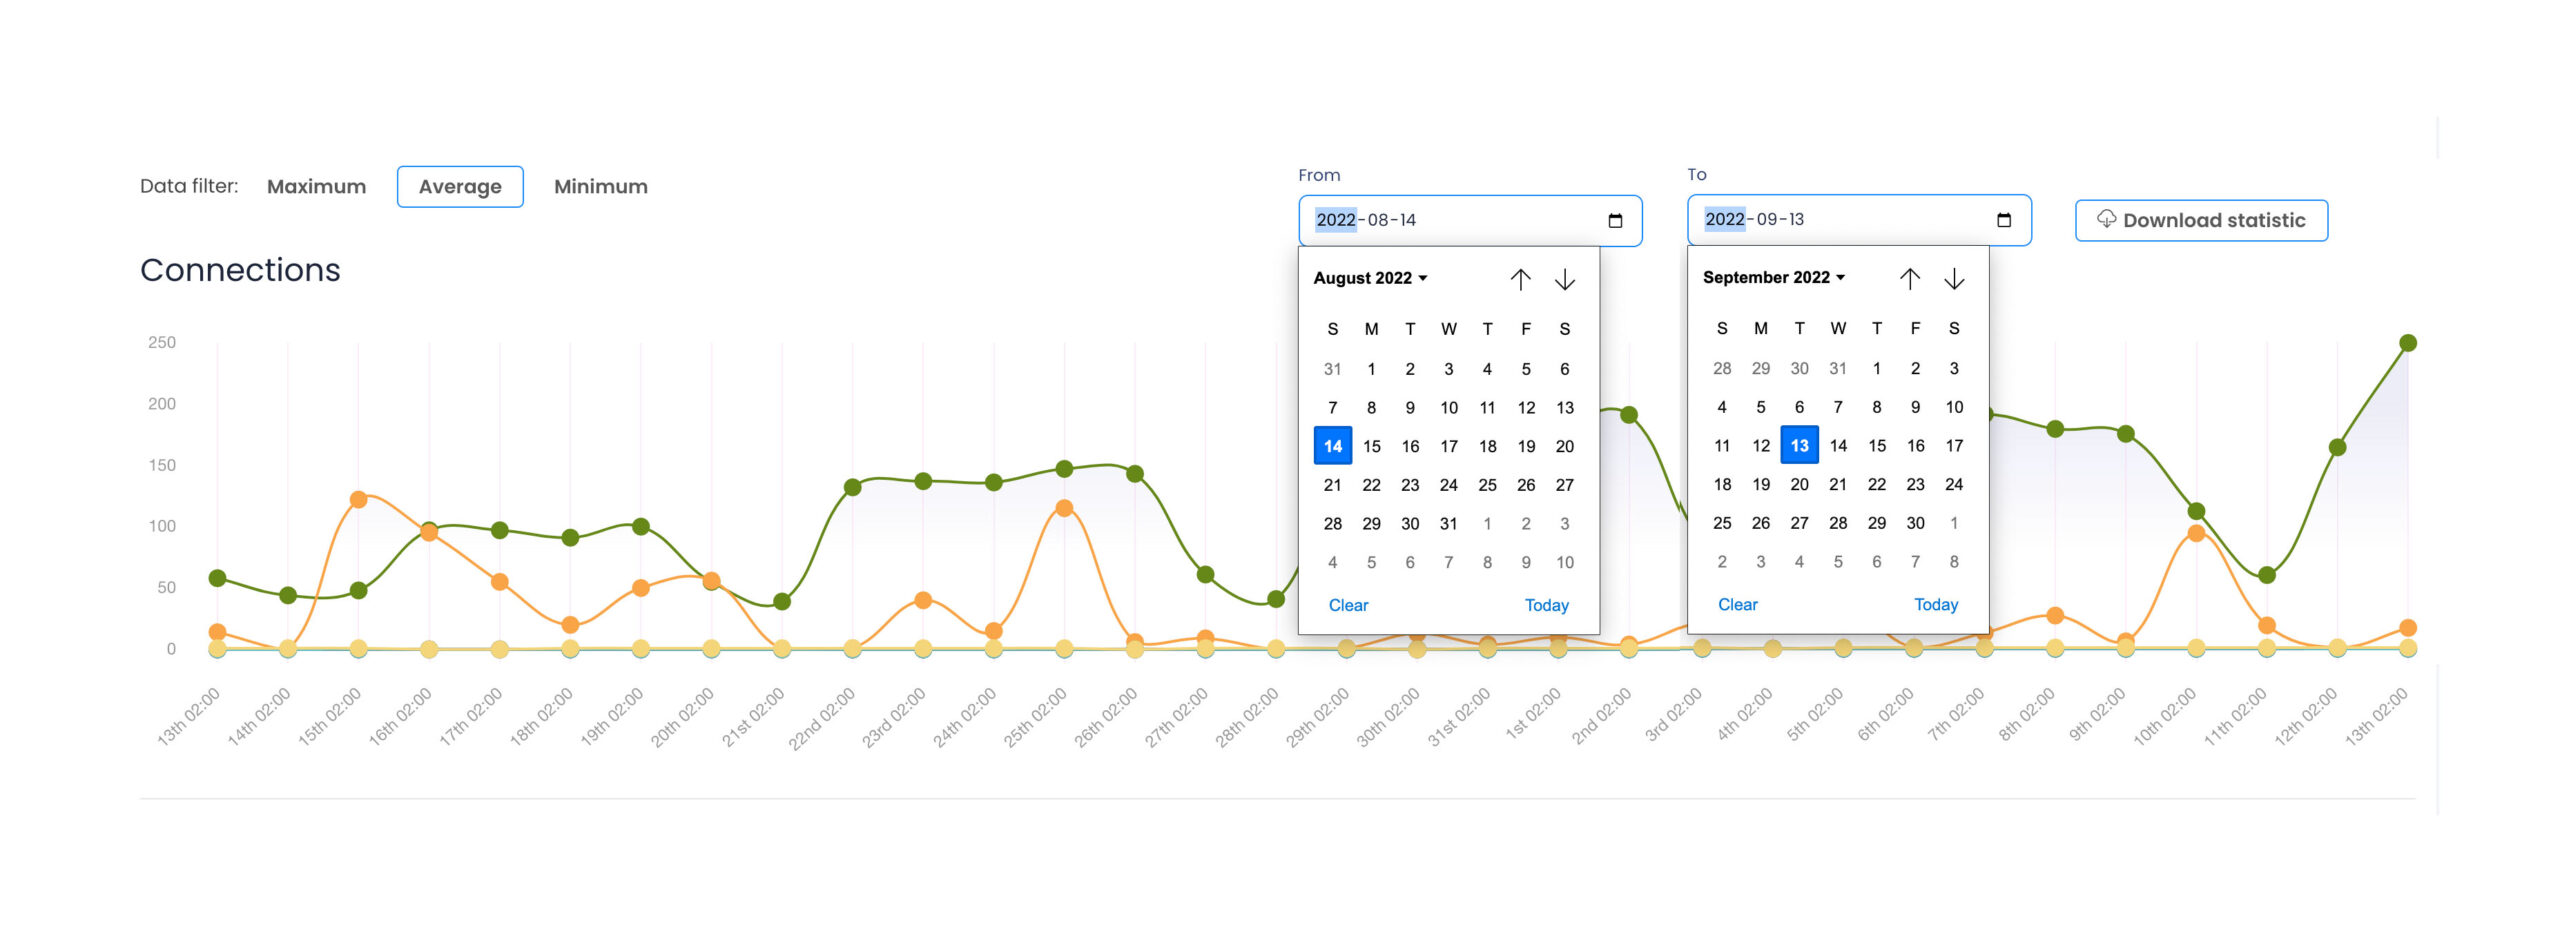
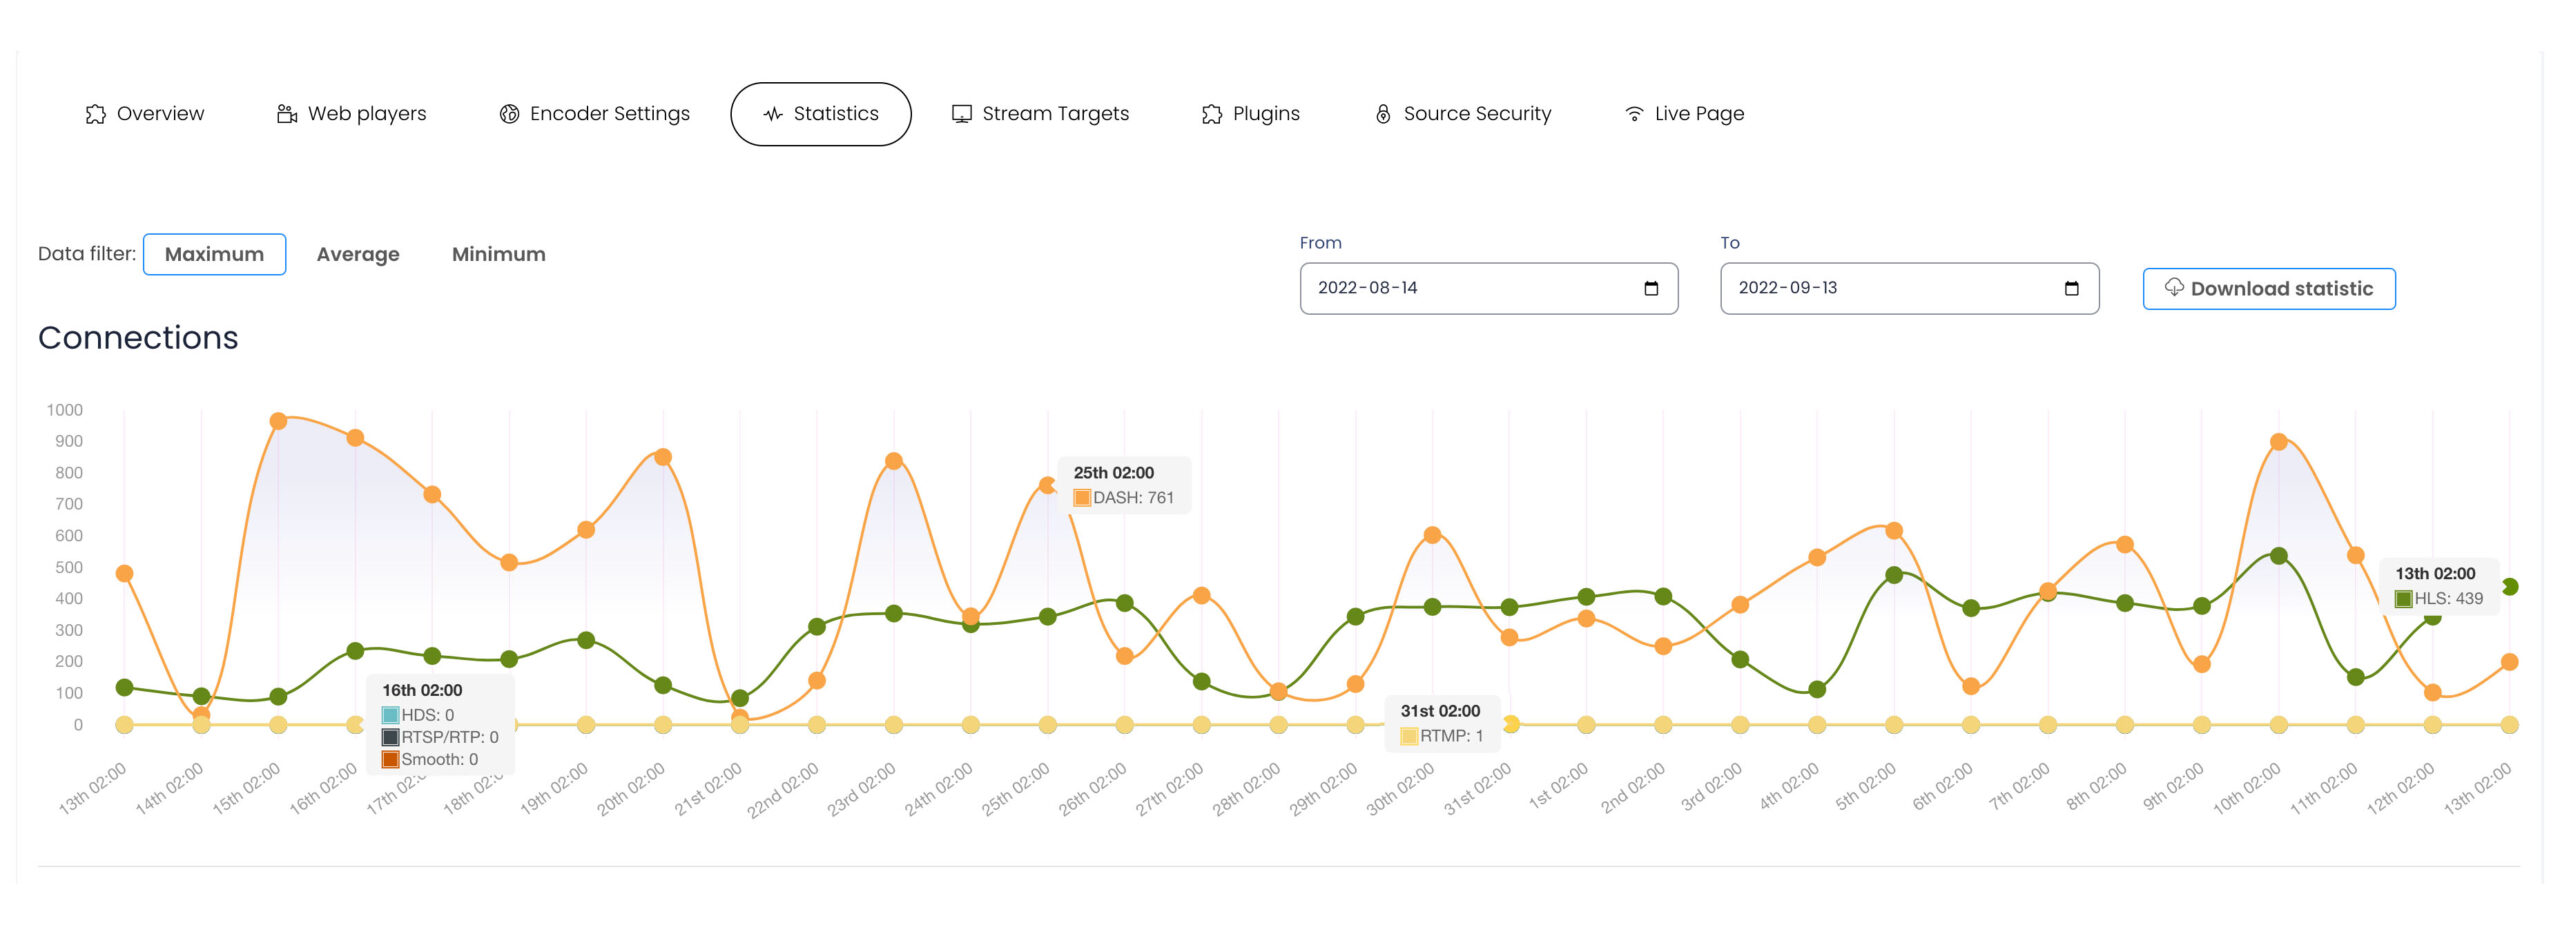
Connections
The Connections line chart displays the connection data of various protocols over a period of time. The chart showcases the trend of RTMP, HDS, DASH, HLS, and RTSP/RTP Smooth connections, which can be selected through the plugins playback option. The graph provides an accurate representation of the historic connection data, allowing the user to understand the usage and performance of each protocol. The visual representation of the data makes it easier to identify patterns and make informed decisions. The Connections line chart is an essential tool for those who need to monitor the performance of their protocols and make data-driven decisions.
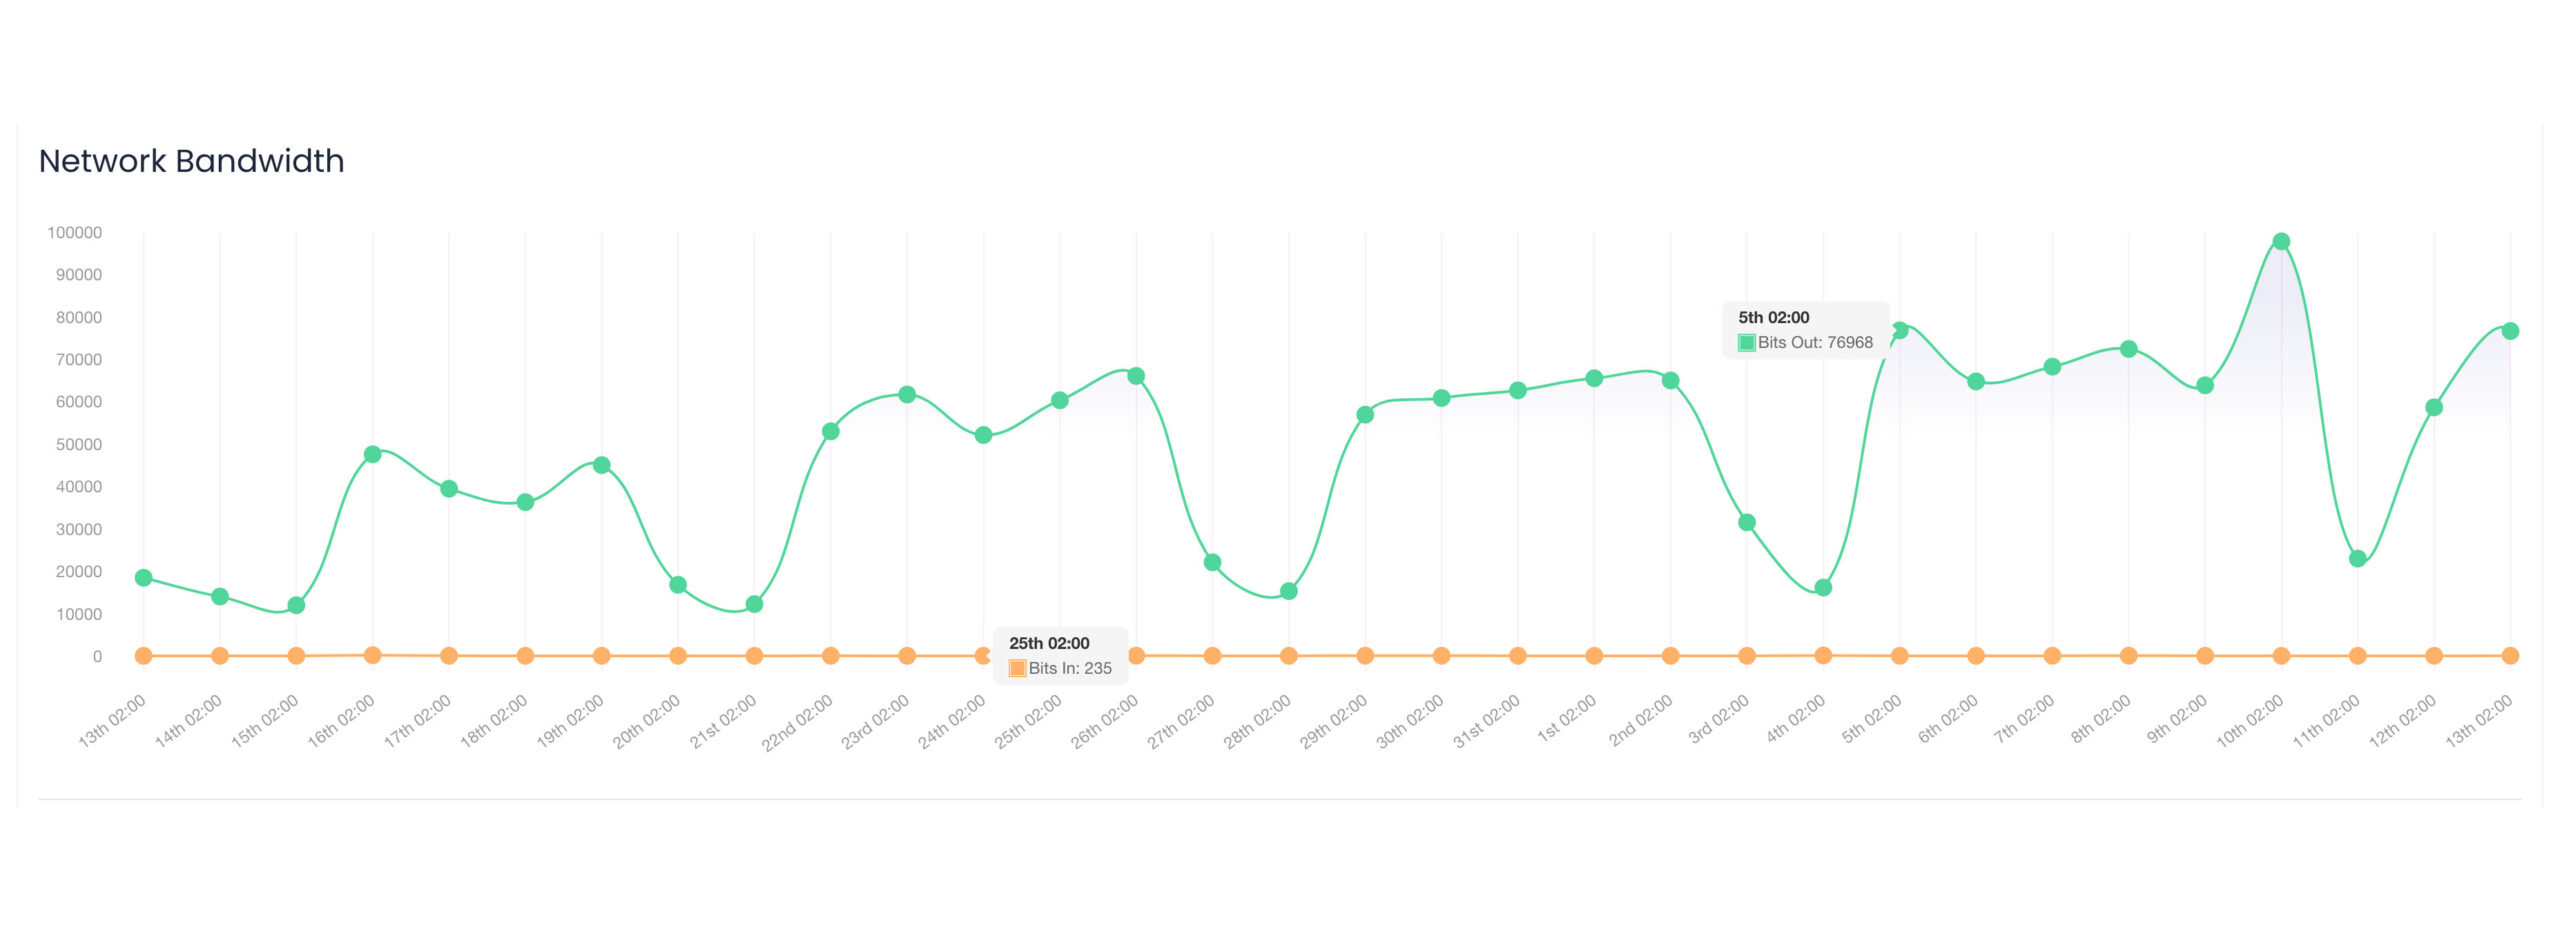
Network Bandwidth
MojoCP is a powerful and advanced network monitoring tool designed to collect and monitor the bandwidth usage of networks in real-time. It uses advanced algorithms and techniques to measure the amount of data being transmitted and received over a network, and provides valuable insights into network performance.
MojoCP is capable of collecting network bandwidth information in both directions, which includes both incoming and outgoing data. This allows administrators to have a comprehensive understanding of their network’s bandwidth usage, including which devices and applications are consuming the most bandwidth.
MojoCP provides detailed reports and graphs that show the amount of bandwidth being used at any given time, which makes it easy to identify trends and potential bottlenecks. This information is critical for optimizing network performance, and helps administrators make informed decisions about network infrastructure upgrades and capacity planning.
Overall, MojoCP is an essential tool for managing network performance and ensuring that bandwidth is being used efficiently and effectively. With its robust reporting and analytics capabilities, MojoCP provides administrators with the information they need to make informed decisions about their networks and optimize performance.
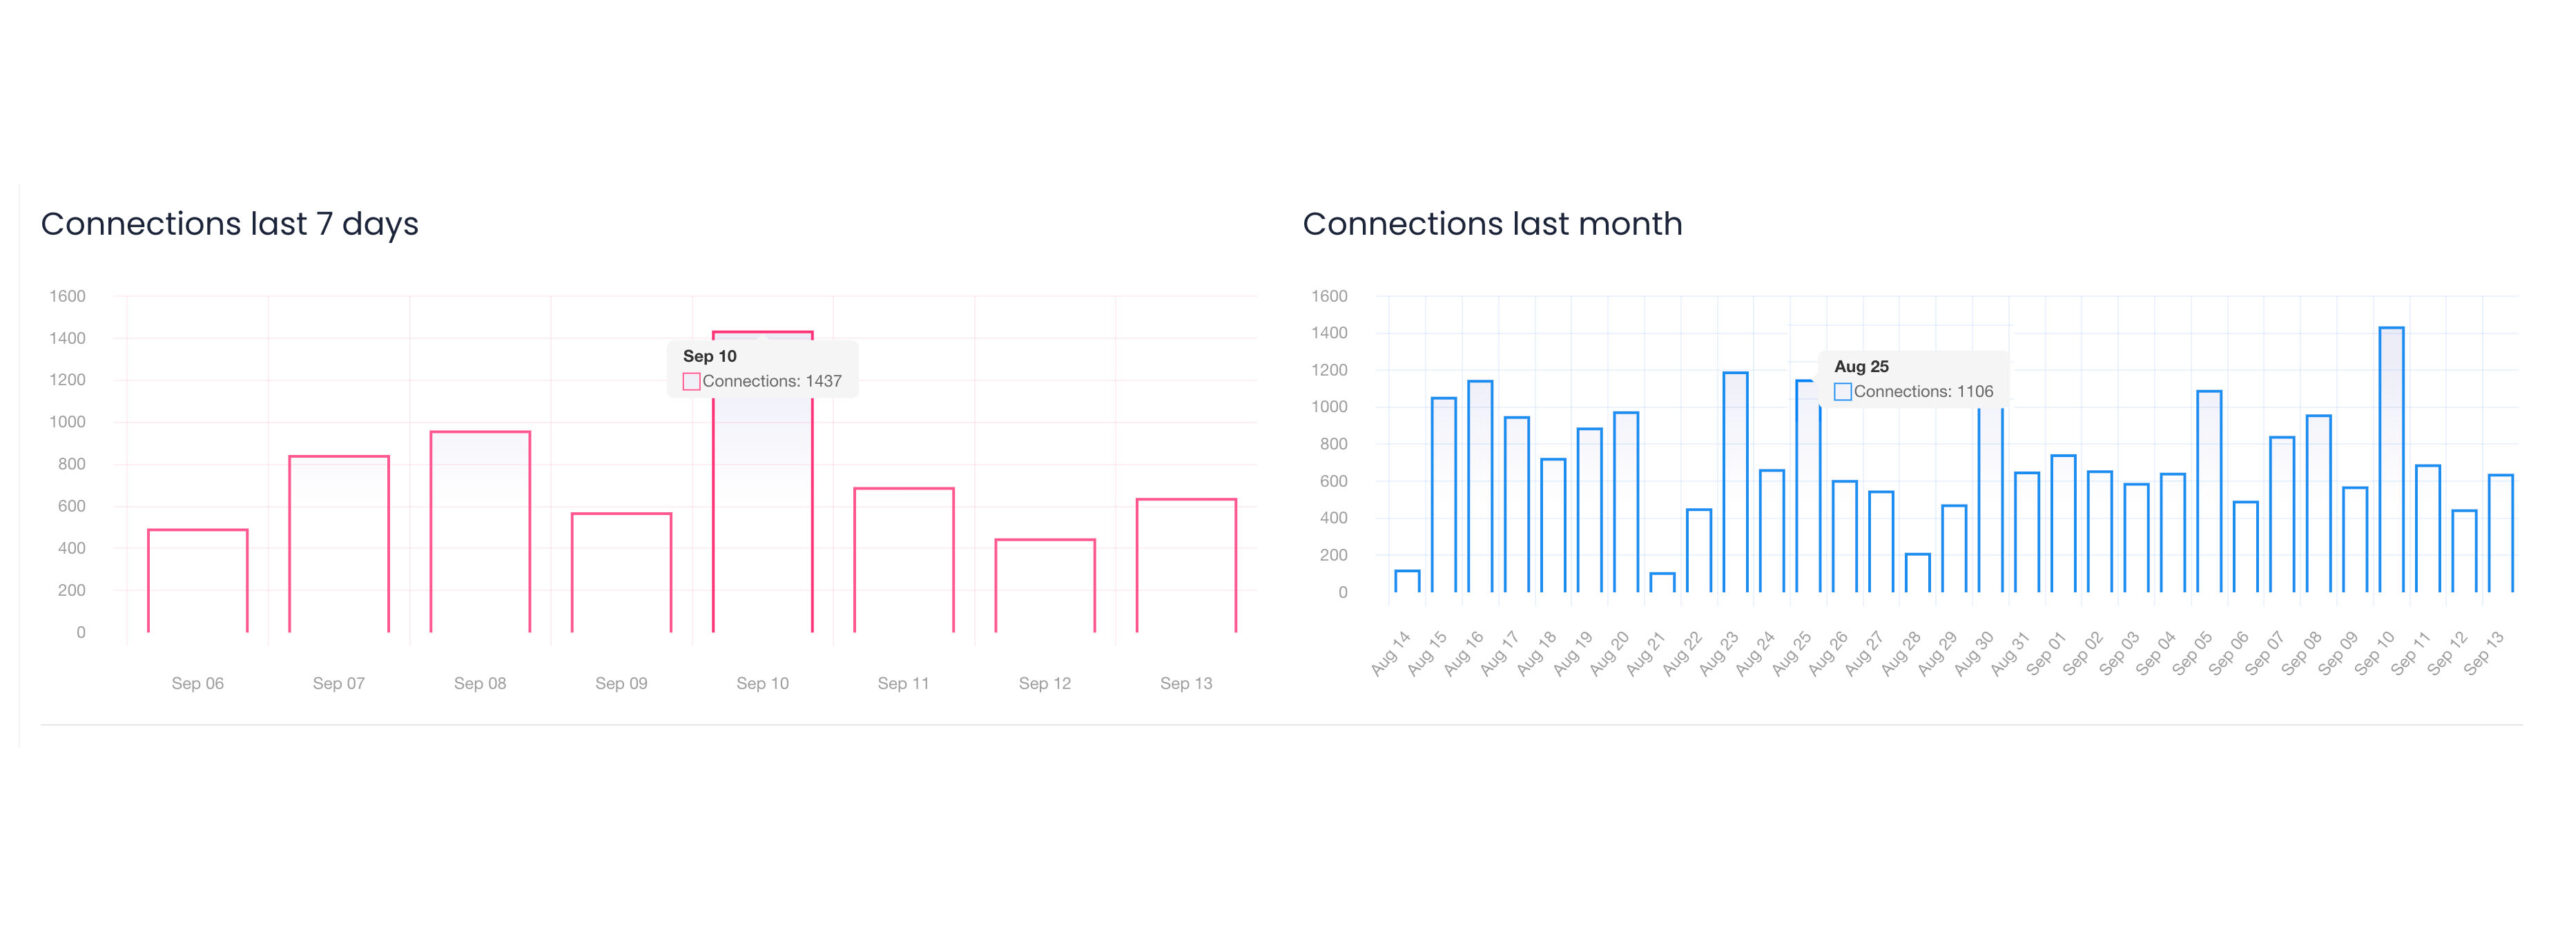
Connections last 7 days and last month
Information about real-time data, connections viewers, for weekly and monthly.
Real-time data refers to information that is being updated and made available in real-time, or near real-time. This type of data is typically updated every few seconds or minutes and provides an up-to-date view of the information being tracked. Examples of real-time data include stock prices, weather updates, sports scores, and traffic conditions.
In terms of connections viewers, the number of people who are viewing the real-time data at any given moment is known as the connections viewer. This number is constantly changing as more people tune in and others drop off, providing a real-time snapshot of the data’s popularity.
For weekly and monthly analysis, real-time data can be used to track trends and patterns over time. For example, by analyzing real-time traffic conditions over the course of a week, a city can better understand when and where traffic congestion is most severe, and make changes to improve traffic flow. Similarly, by tracking real-time stock prices over the course of a month, an investor can identify trends and make informed investment decisions.
In conclusion, real-time data and connections viewers are important tools for understanding and tracking information in real-time. By analyzing this data over weekly and monthly periods, individuals and organizations can gain valuable insights and make informed decisions.
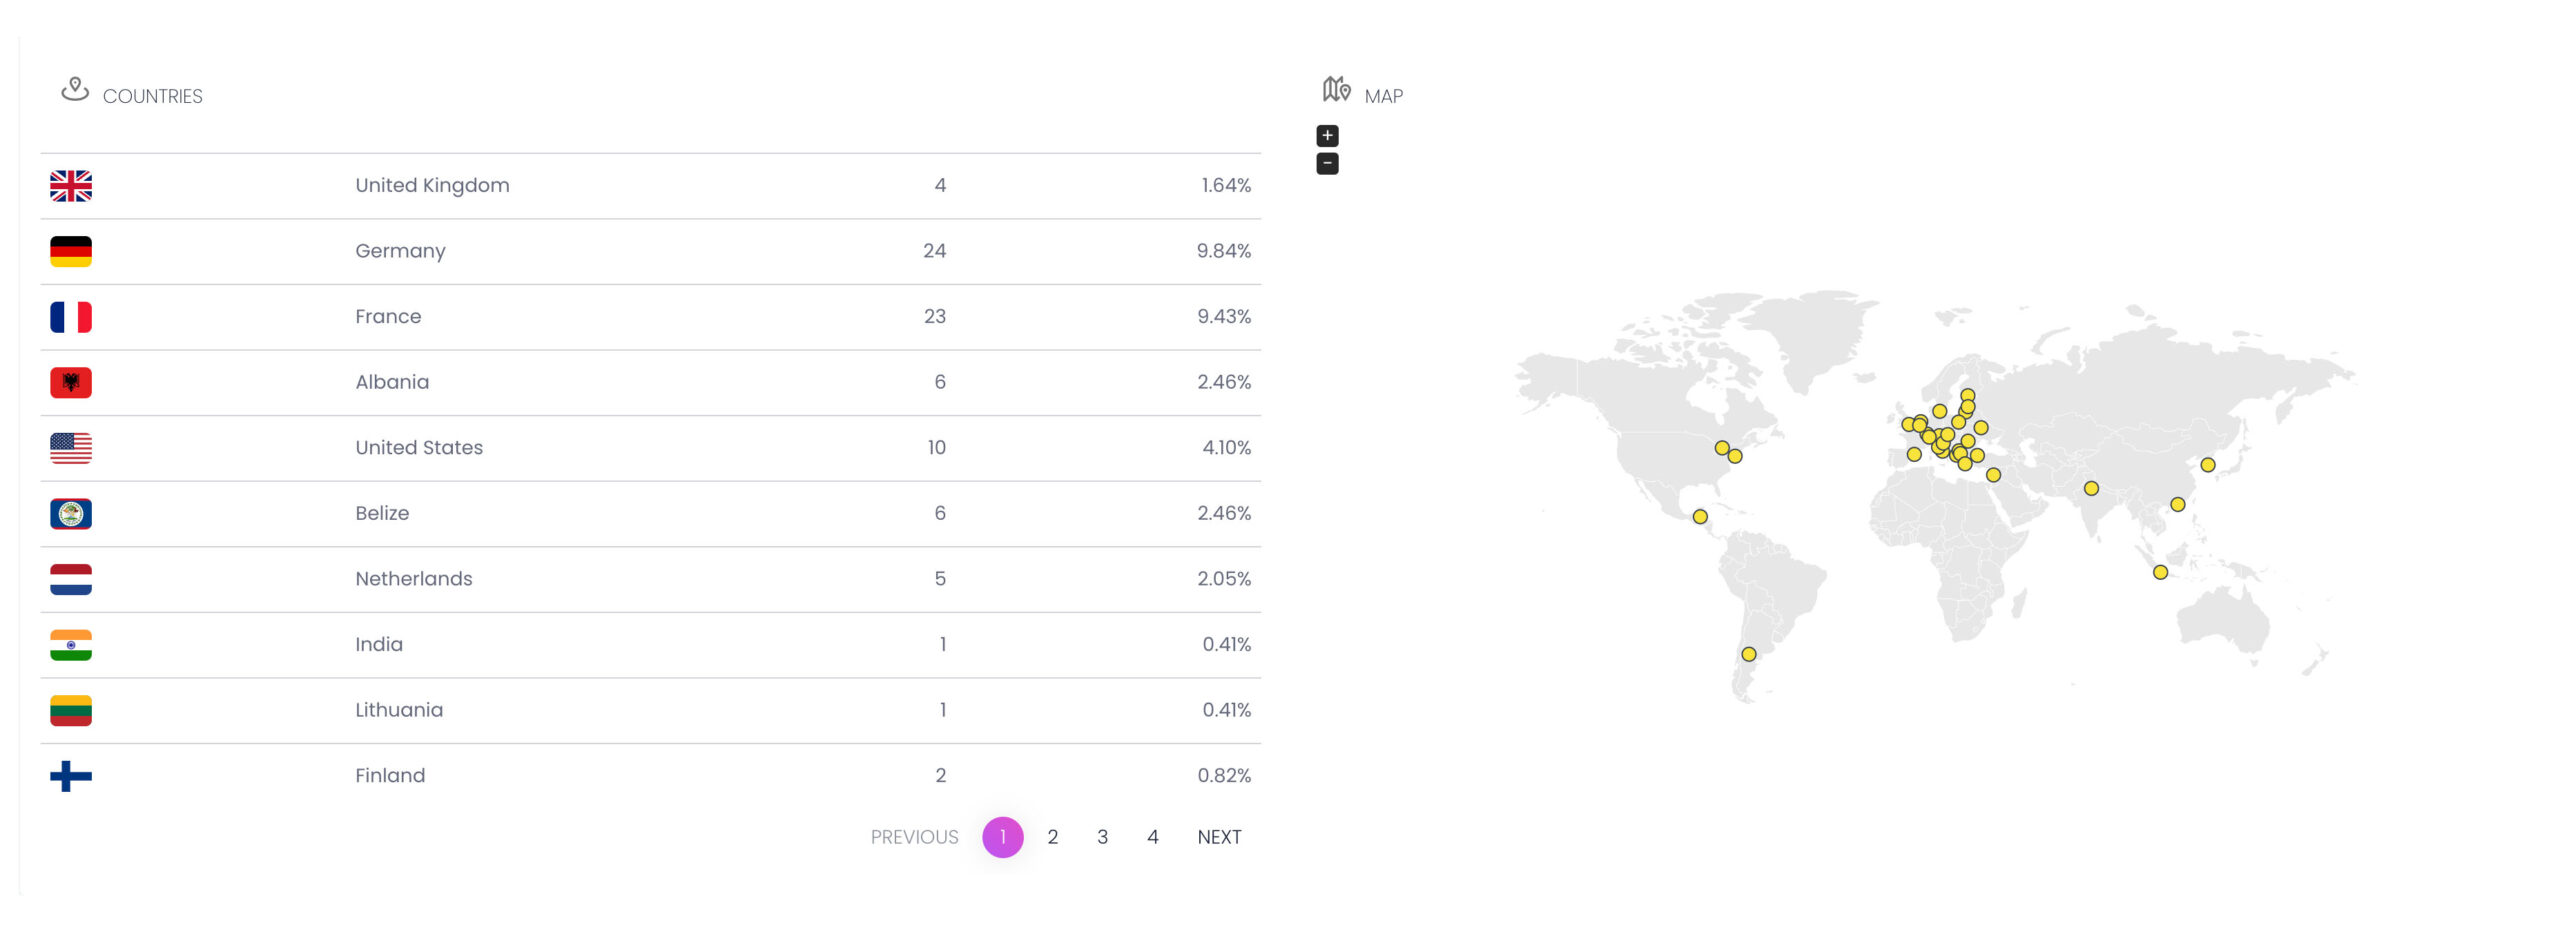
Countries & Map
A “Country Map” on MojoCP is a visual representation that displays the geographic locations of viewers, based on the country information that is available. It shows the distribution of viewers across different countries, represented by different colors or markers on a map. The map is dynamic and updates in real-time, reflecting the current location information of the viewers. This feature provides valuable insights into the audience demographics and can be useful for businesses and content creators to understand their audience better and make informed decisions.
Reports
Reports are generated in CSV format. You can specify that data from a specific date range by selecting a predefined date and range in a list and download the reports for each day and month.
The Mojocp Reports are a comprehensive tool for generating and downloading data in an organized and user-friendly manner. The reports are generated in CSV format, which is a widely accepted and easily readable format for data management. The reports can be customized based on specific date ranges, giving you the flexibility to choose data from a predefined list. This allows you to select a date and range that suits your needs and quickly download the reports for each day and month. With the Mojocp Reports, you can access important data in a timely and efficient manner, making it easier to analyze and make informed decisions.